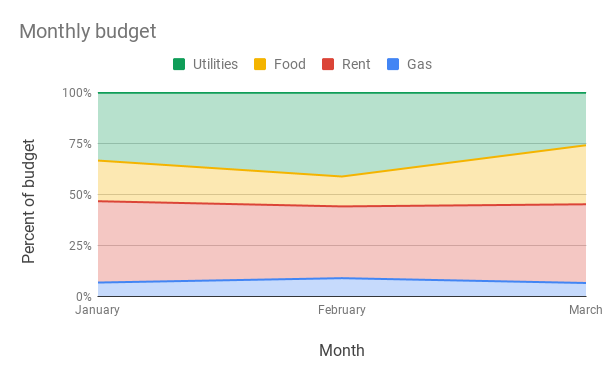
Use an area chart to find trends in data over time. Area charts are like line charts, but shade below the lines to help show the magnitude of trends.
Learn how to add & edit a chart.

How to format your data
- First column: Enter a label to describe the data. Labels from the first column show up on the horizontal axis.
- First row (Optional): In the first row of each column, enter a category name. Entries in the first row show up as labels in the legend.
- Other columns: For each column, enter numeric data. You can also add a category name (optional).
- Other cells: Enter the data points you’d like to display.
- Rows: Each row represents a different line in the chart.
Tip: If the chart doesn’t show the data on the axis you want, learn how to switch rows and columns.
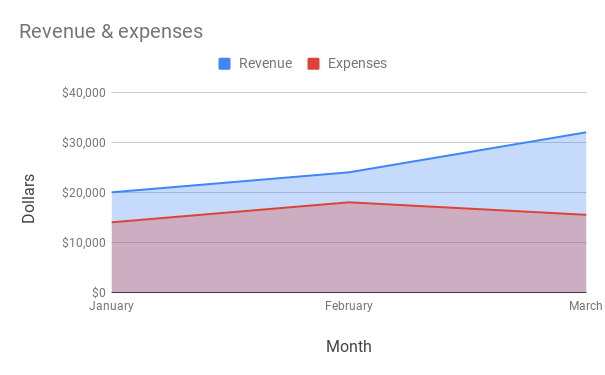
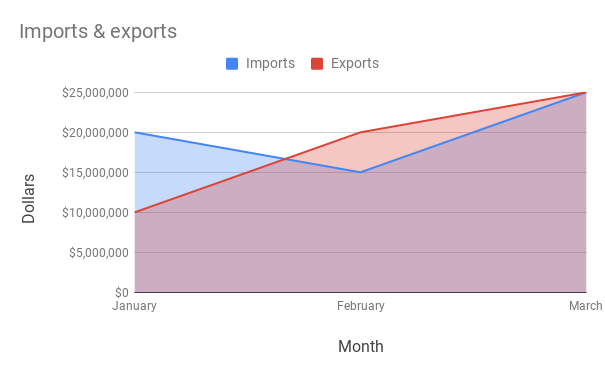
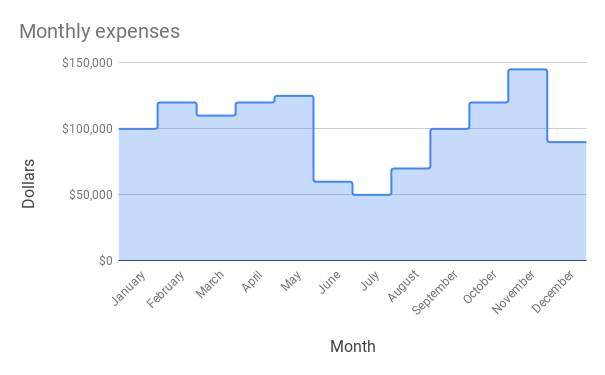
Examples
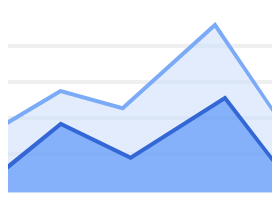
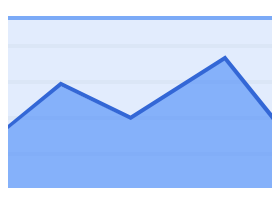
Other types of area charts


Customize an area chart
- On your computer, open a spreadsheet in Google Sheets.
- Double-click the chart you want to change.
- At the right, click Customize.
- Choose an option:
- Chart style: Change how the chart looks.
- Chart & axis titles: Edit or format title text.
- Series: Change line colors, axis location, or add error bars, data labels, or trendline.
- Legend: Change legend position and text.
- Horizontal axis: Edit or format axis text, or reverse axis order.
- Vertical axis: Edit or format axis text, set min or max value, or log scale.
- Gridlines: Add and edit gridlines.